Politicians love to throw around economic statistics on the campaign trail. In the runup to an election we tend to hear about American jobs, small businesses as the backbone of the economy, inflation, government spending, and more.
It can be difficult to sort through various talking points to ascertain what’s happening in the economy. To that end, we put together a nonpartisan primer to help you cut through the spin.
One thing to keep in mind: We’re not that far removed from COVID-19 which you’ll see play out repeatedly in the data.
The overall economy
Gross domestic product (GDP) is the primary metric for measuring economic growth. GDP is the monetary value of all the goods and services produced by a country. The government calculates this number quarterly; comparing current GDP to past numbers illustrates how the economy is growing or shrinking over time.
On average, the U.S. economy has grown roughly 3.2% per year since 1947.
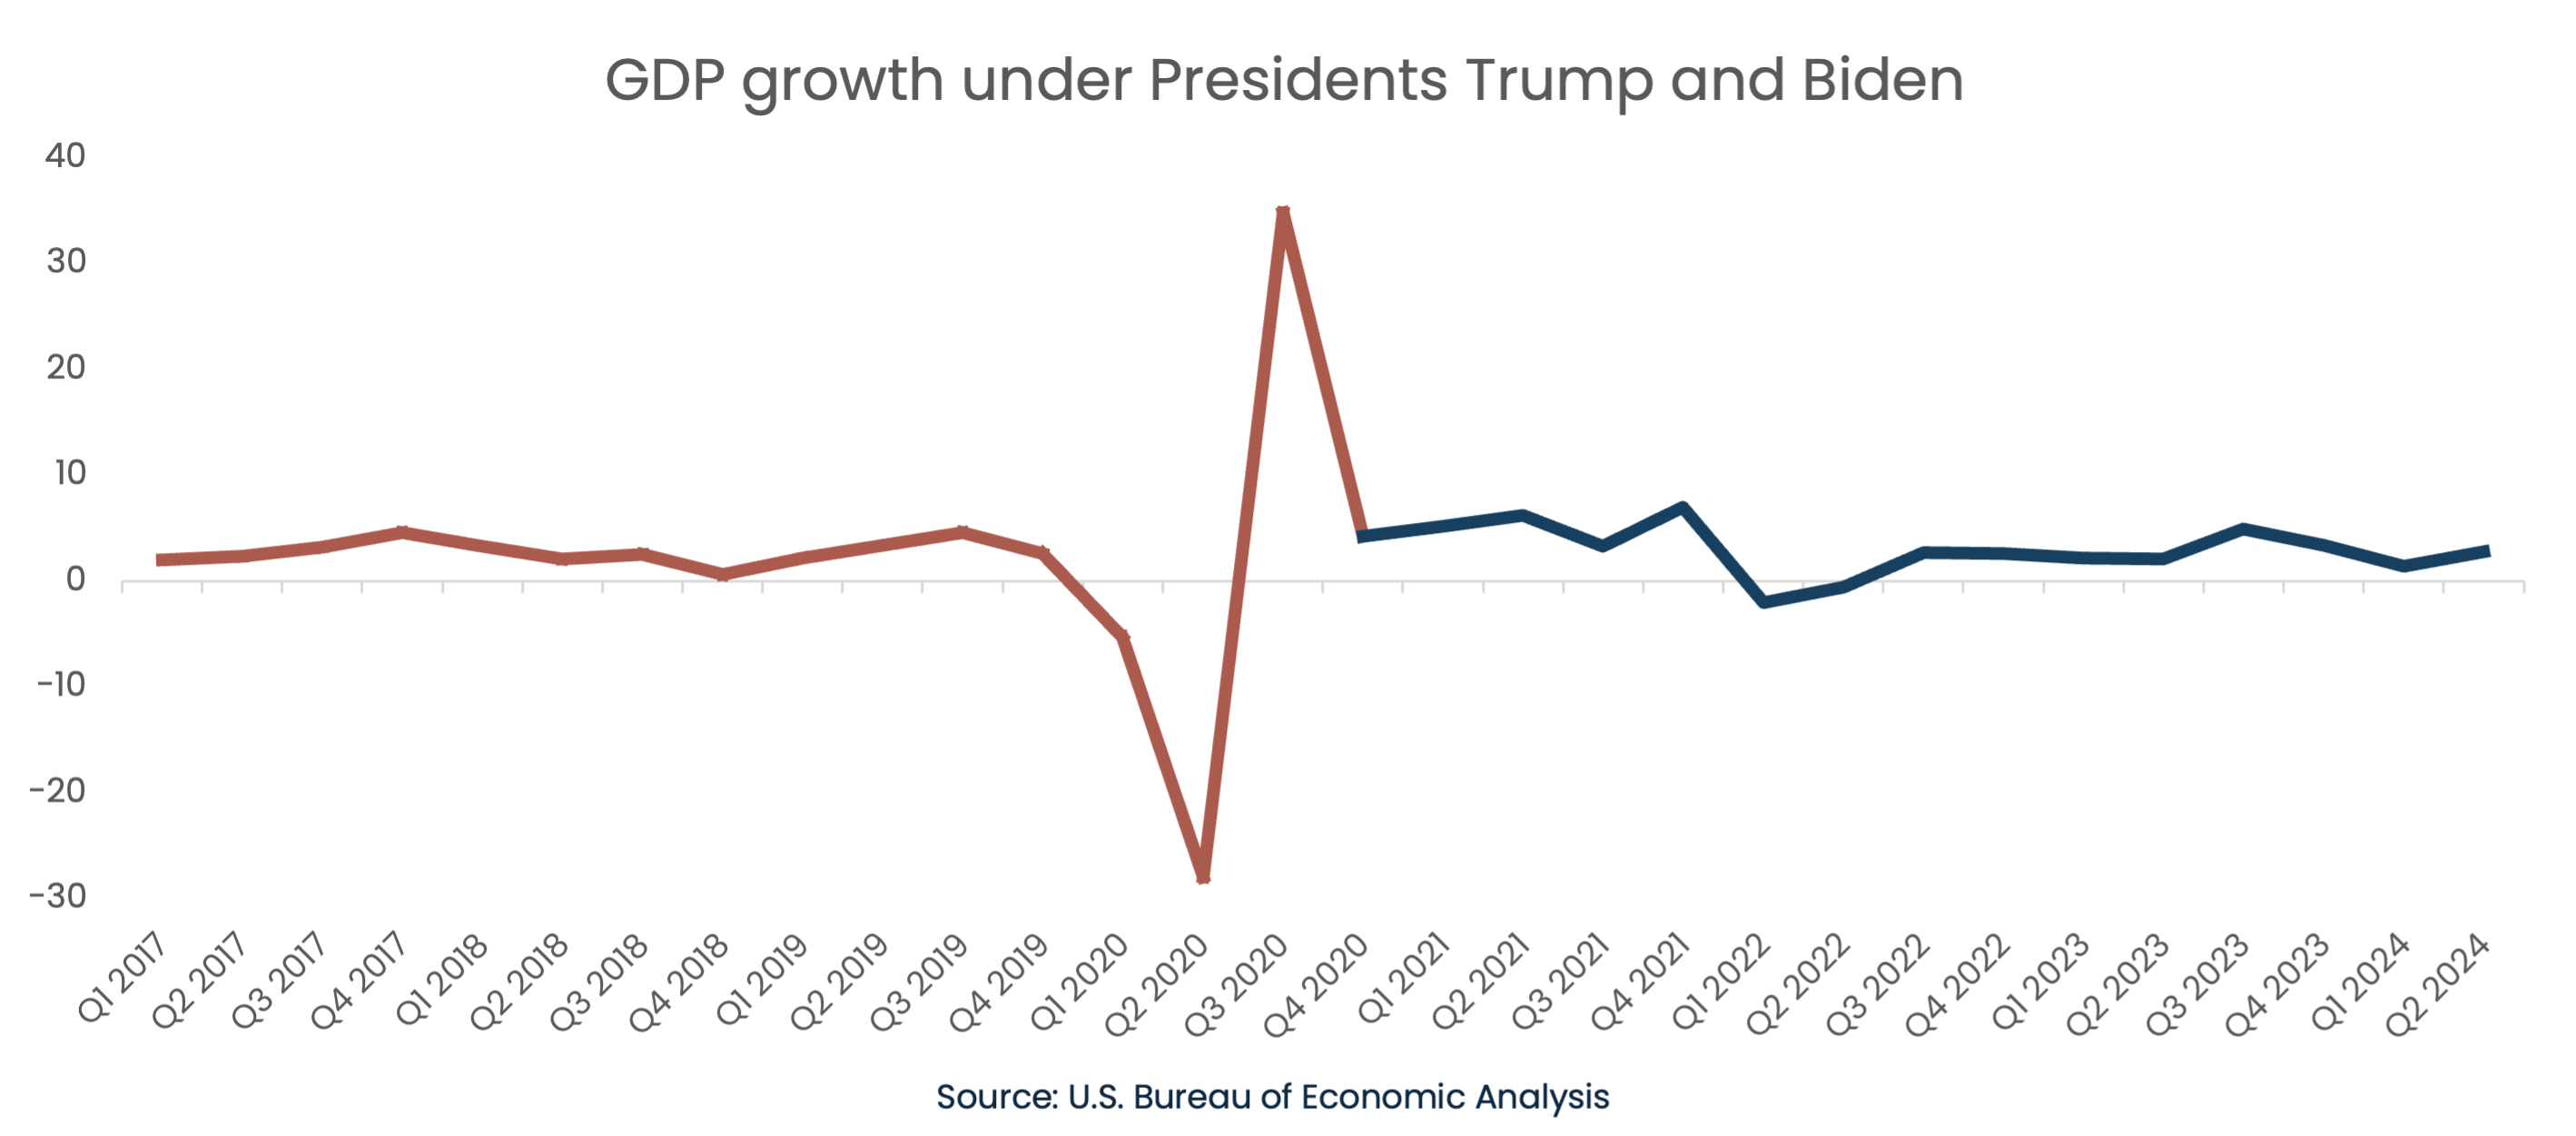
If you remove 2020 from the equation to account for COVID-19, the economy grew roughly 2.7% per year under both Trump and Biden. In other words, the overall economy was strong under both parties and presidents, according to the headline data.
Of course, our impression of the economy tends to be tied to our personal finances more than GDP, so let’s look at a few additional data points.
Employment and jobs
At a personal level, having a job (or being able to find work) is one of the biggest components of our financial security. If we can find work and are earning good money, we tend to view the economy more favorably.
That said, the job market interacts with the overall economy in complex ways. Consider how improvements in technology can increase productivity and output (in turn boosting GDP) while eliminating jobs. On the other hand, paying workers more means they have more money to spend and stimulate the economy, but lower margins could mean investing less in research or growth.
Politicians love to talk about the various ways jobs impact the economy and stock market, as much can be left up to interpretation. To help ground those conversations, we went to the data. Let’s start with the unemployment picture under Trump and Biden.
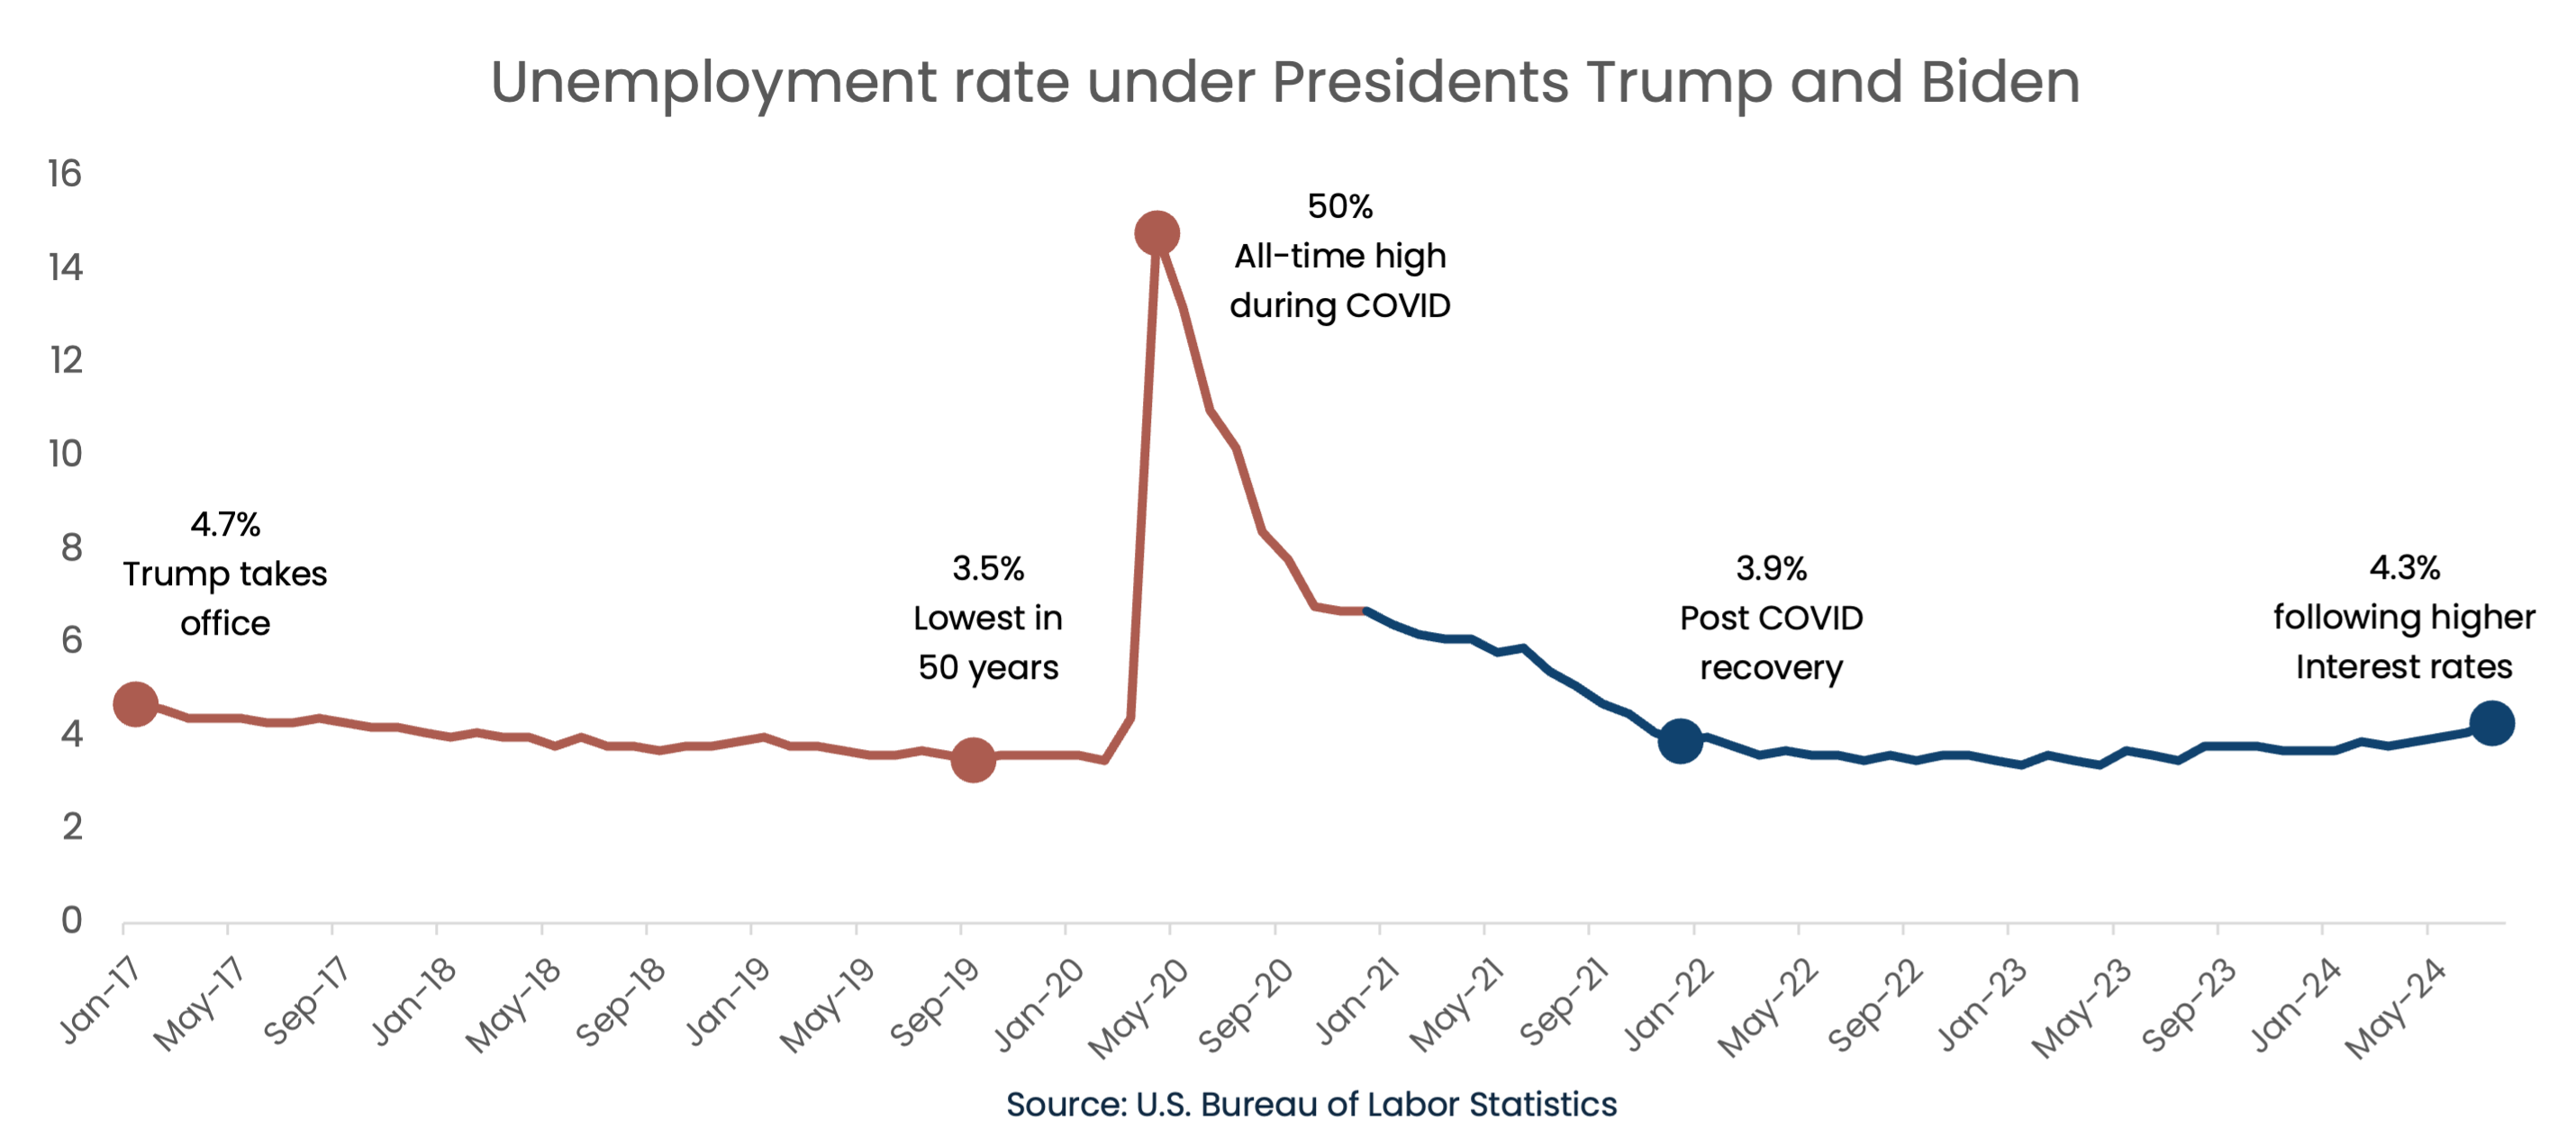
For context: The long-term historical average unemployment rate is 5.69%.
If you feel like the overall unemployment rate doesn’t reflect what you’ve seen play out in your own career, it may come down to where you live and the industry you work in.
While the tech sector is driving the stock market, for instance, it may not be driving employment the same way. The Department of Labor tracks technology jobs as part of the broader “information” industry, which encompasses everything from data analysis and telecommunications to movies and sound engineers.
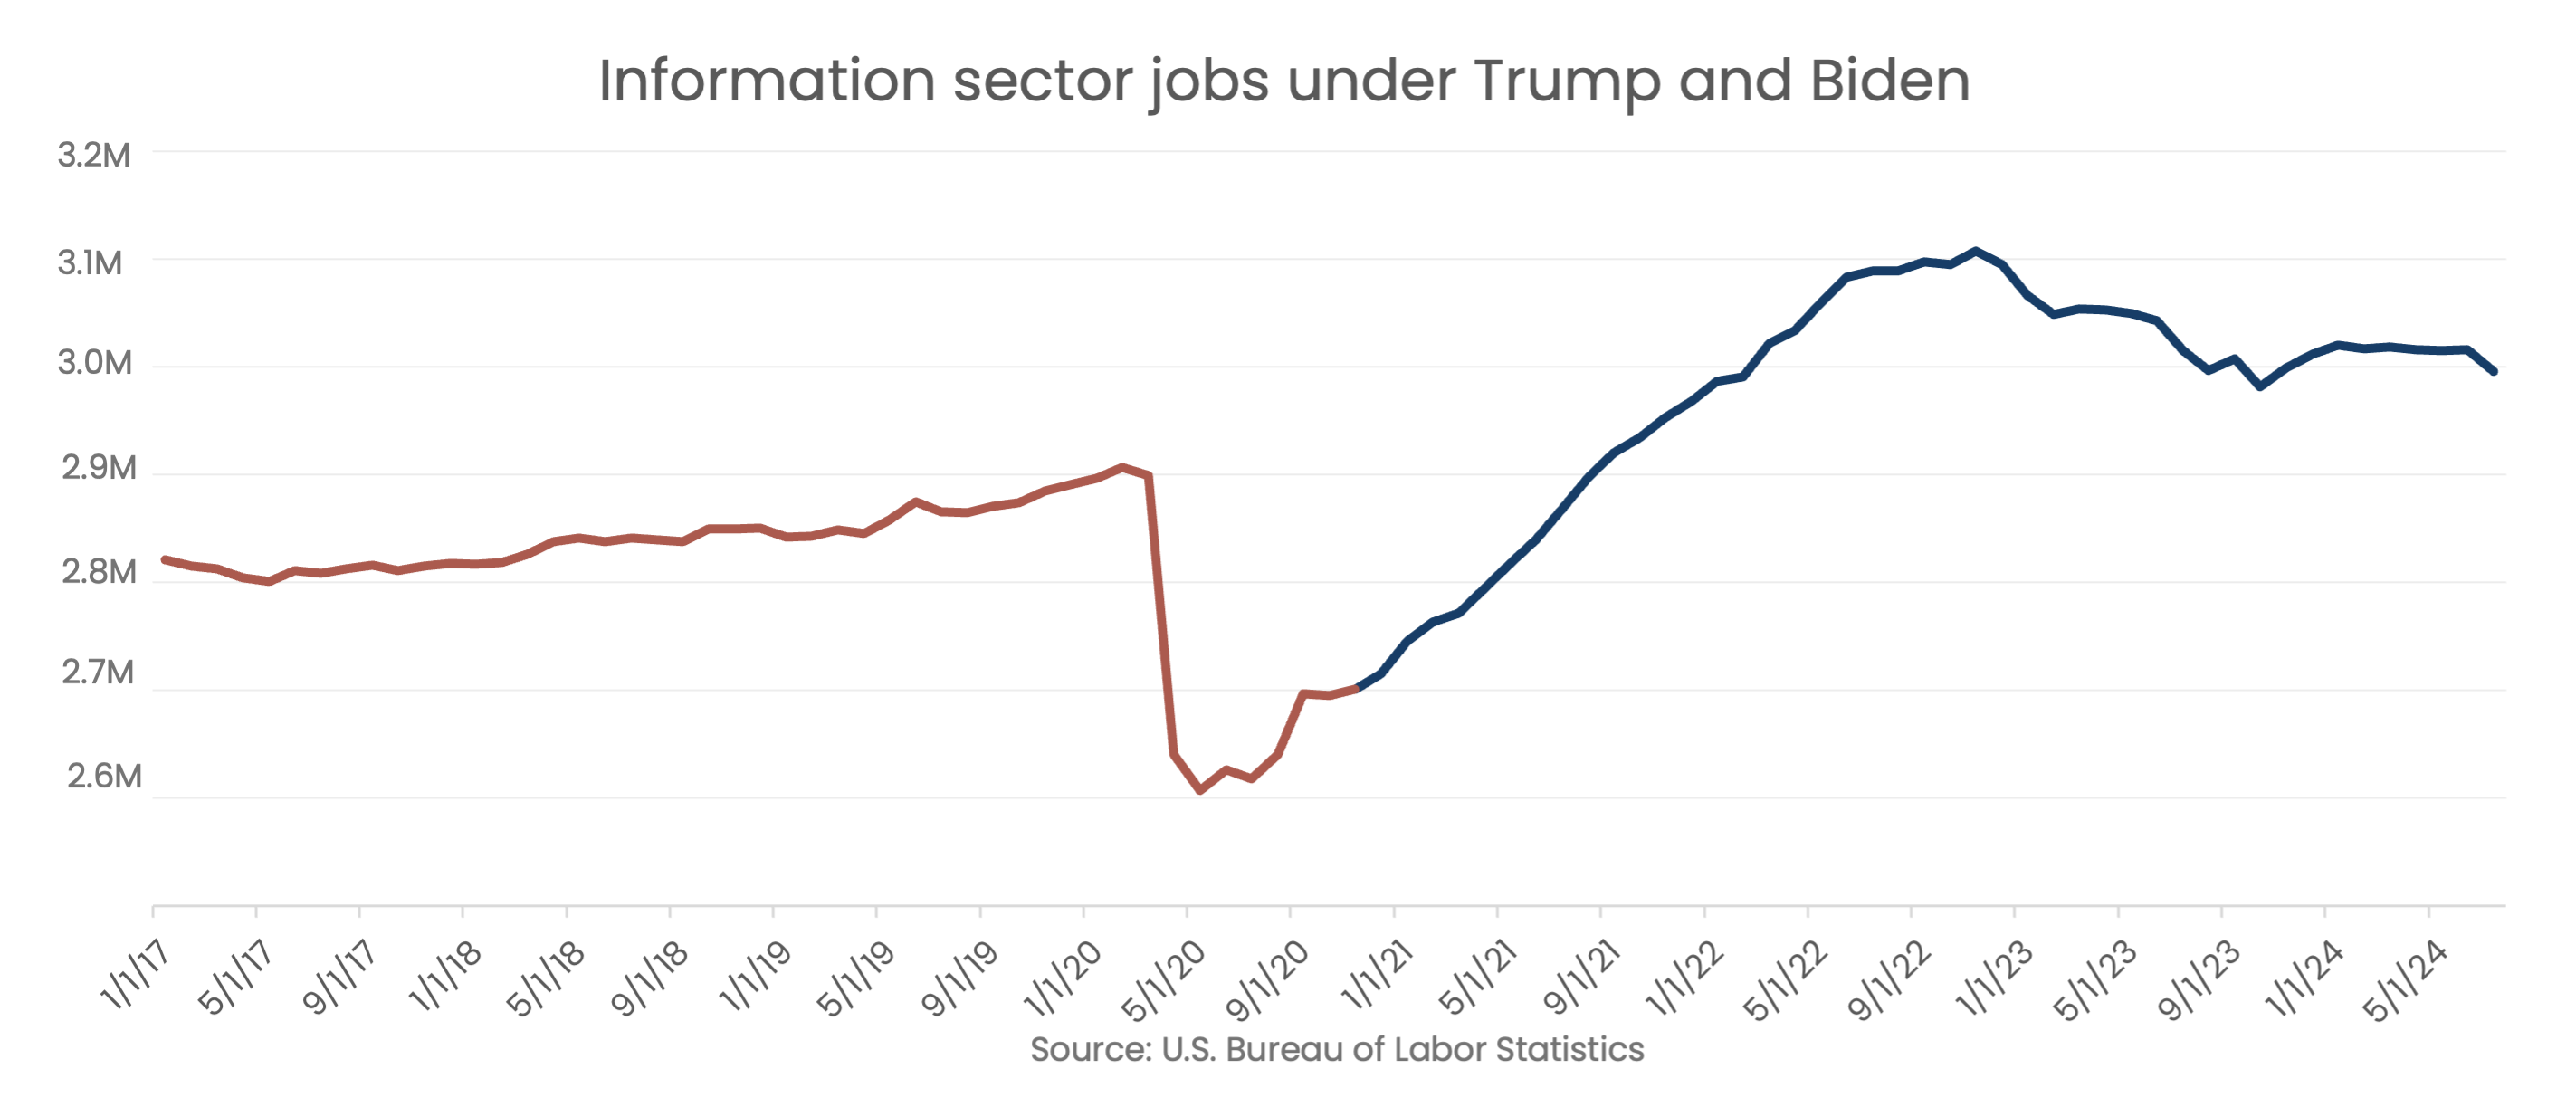
Despite numerous high-profile layoffs over the past decade, the sector has been adding jobs. The dips around COVID-19 and higher interest rates mirror trends in overall employment.
Big government and small business
As important as the unemployment rate is, it doesn’t cover everything about the jobs market. In fact, nonfarm payrolls—the go-to metric for measuring the number of jobs added or cut each month—only represents about 80% of U.S. workers. It excludes farm workers, active military, non-profit workers and anyone self-employed.
Or consider government—while politicians love to discuss big or small government, some 23 million Americans work for the government. The vast majority of these employees work at the state and local level. These jobs include police officers, schoolteachers, municipal workers, and the like.
Within the private sector, small businesses truly are the backbone of the economy, but not by as large a margin as you might think. They account for fewer than half of private sector jobs. That said, most job growth (55%) from 2013-2023 came from businesses with 250 or fewer employees.
Sources: Statista, St. Louis Federal Reserve
Let’s talk taxes
When politicians bring up corporations, they tend to do so in the context of taxes rather than employment. Many of these politicians go back to a single refrain: “Corporations must pay their fair share.” That’s where consensus tends to end.
To better understand the talking points this election cycle, let’s look at where corporate tax rates currently stand.
- In 2018, President Trump signed the Tax Cuts and Job Act into law, cutting the corporate tax rate from 35% to the current (and permanent) 21%.
That doesn’t mean companies pay 21% of their profit to the government each year, however. Companies can use tax credits just like individual filers. Huge multinational corporations can also be strategic with global income to try and minimize their tax liability in the U.S. Here are a few examples.
- Netflix made $6.2 billion in profit in 2023 and paid less than $1 billion in taxes for an effective tax rate of 13%, according to its regulatory filings.
- Microsoft made nearly $63 billion in the US for fiscal 2024 and paid an effective tax rate of 19% according to its regulatory filings.
- Tesla, which paid an effective income tax rate of 8% in 2022 paid no income tax in 2023 and in fact received a $5 billion tax credit (a -50% effective tax rate) for the year, according to its regulatory filings.
On the personal tax side, the 2018 legislation increased the standard deduction significantly, meaning fewer Americans itemized their taxes. That provision is set to expire at the end of 2025 when the next president is in office.
Tax vs. tariff
We live in a global economy, making trade a centerpiece of American prosperity and growth. There can be a delicate balance surrounding how we handle imports from, and exports to, key trading partners.
As a refresher: Tariffs are a tax charged on imported goods. The importing country pays the tariffs.
If the U.S. imposes tariffs on item X from country A, American buyers of item X pay the tariff, not the exporters in country A. In other words, the government may be hoping to discourage Americans from buying item X from country A. If no other option is available, importers paying higher tariffs may pass those costs on to U.S. consumers. Similarly, if country A imposes tariffs on U.S. goods, consumers in that country may have to pay more for American products, which could impact overseas sales.
While much of the political conversation about trade tends to focus on China, we do significantly more trade with our neighbors in North America. Let’s look at the numbers:
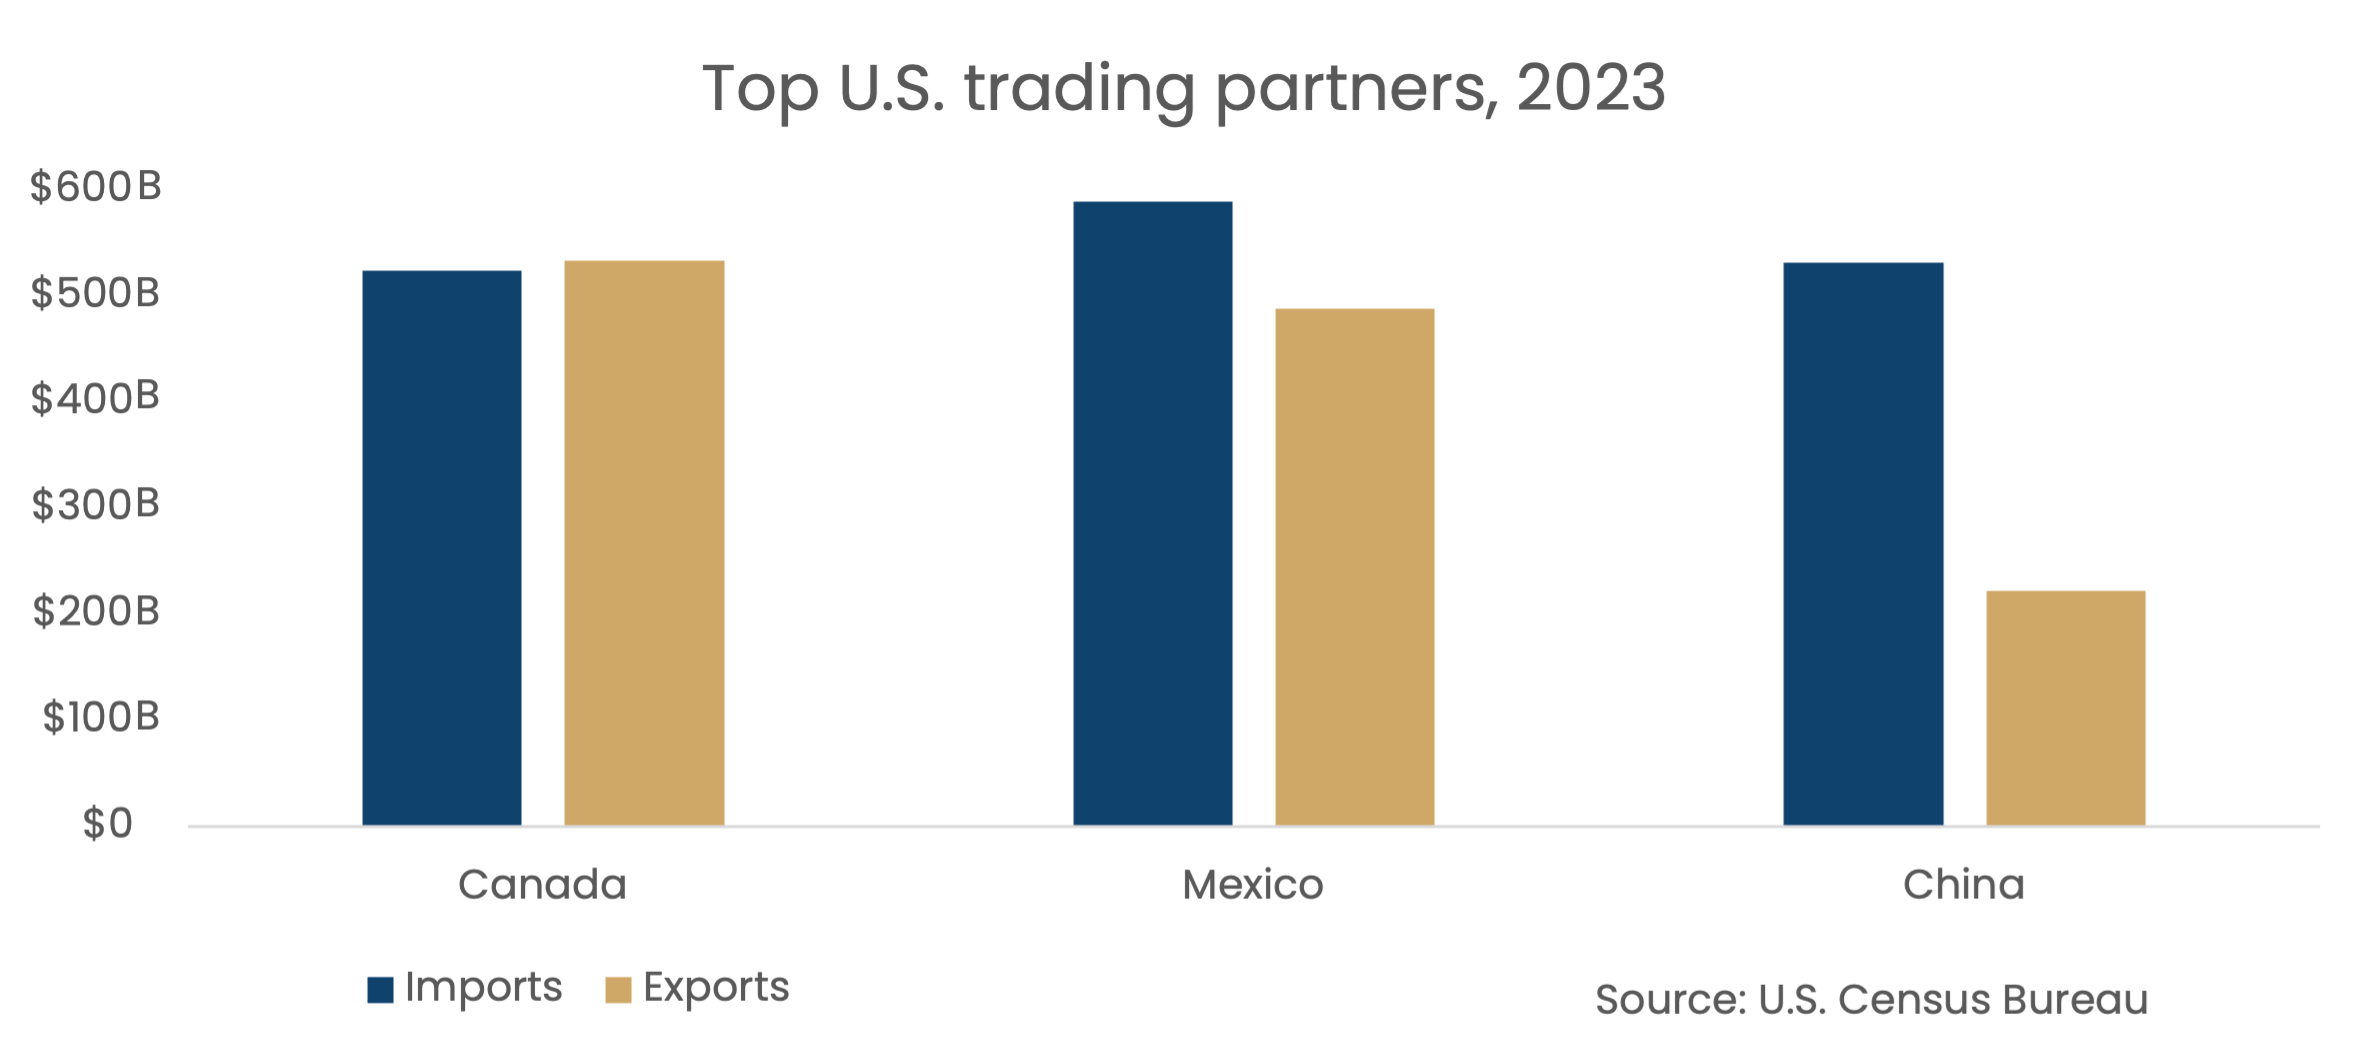
In 2023, the U.S. exported nearly $3.05 trillion in goods and services and imported about $3.83 trillion. While the country imported more than it exported, the overall trade deficit (as a percentage of GDP) shrank from 2022 to 2023.
Printing money
Another favorite talking point? How the government earns and spends money. The conversation primarily focuses on three points: the deficit, the national debt, and “printing money.”
First, the deficit—this refers to the annual budget passed by Congress. If the government plans to spend more than it makes, it runs on a deficit. (Government income comes primarily from taxes and borrowing—often in the form of Treasury bonds.)
It’s rare for Congress to pass a balanced budget, and rarer still for legislators to achieve a budget surplus. (It last happened in 2001.)
Ongoing budget deficits cause the total national debt—how much the government owes, primarily via Treasury bonds—to increase significantly every year.
Finally, politicians love to allude to the government printing money as a way to pay for things. While the President can simply ask Treasury to print money, there’s another element at play. When the Federal Reserve (which is designed to be non-partisan) seeks to regulate the economy—to stimulate jobs, for instance—it has tools in its belt beyond interest rates. If rates are already at zero, the central bank can expand its balance sheet to help.
How the Fed does this can be quite complicated, but it ultimately means the Fed asks the Treasury to print money. These requests are independent of the executive branch. As you can see below, expansion of the balance sheet (and money printing) coincides more with economic events, such as the Financial Crisis or COVID, than with a particular political party.
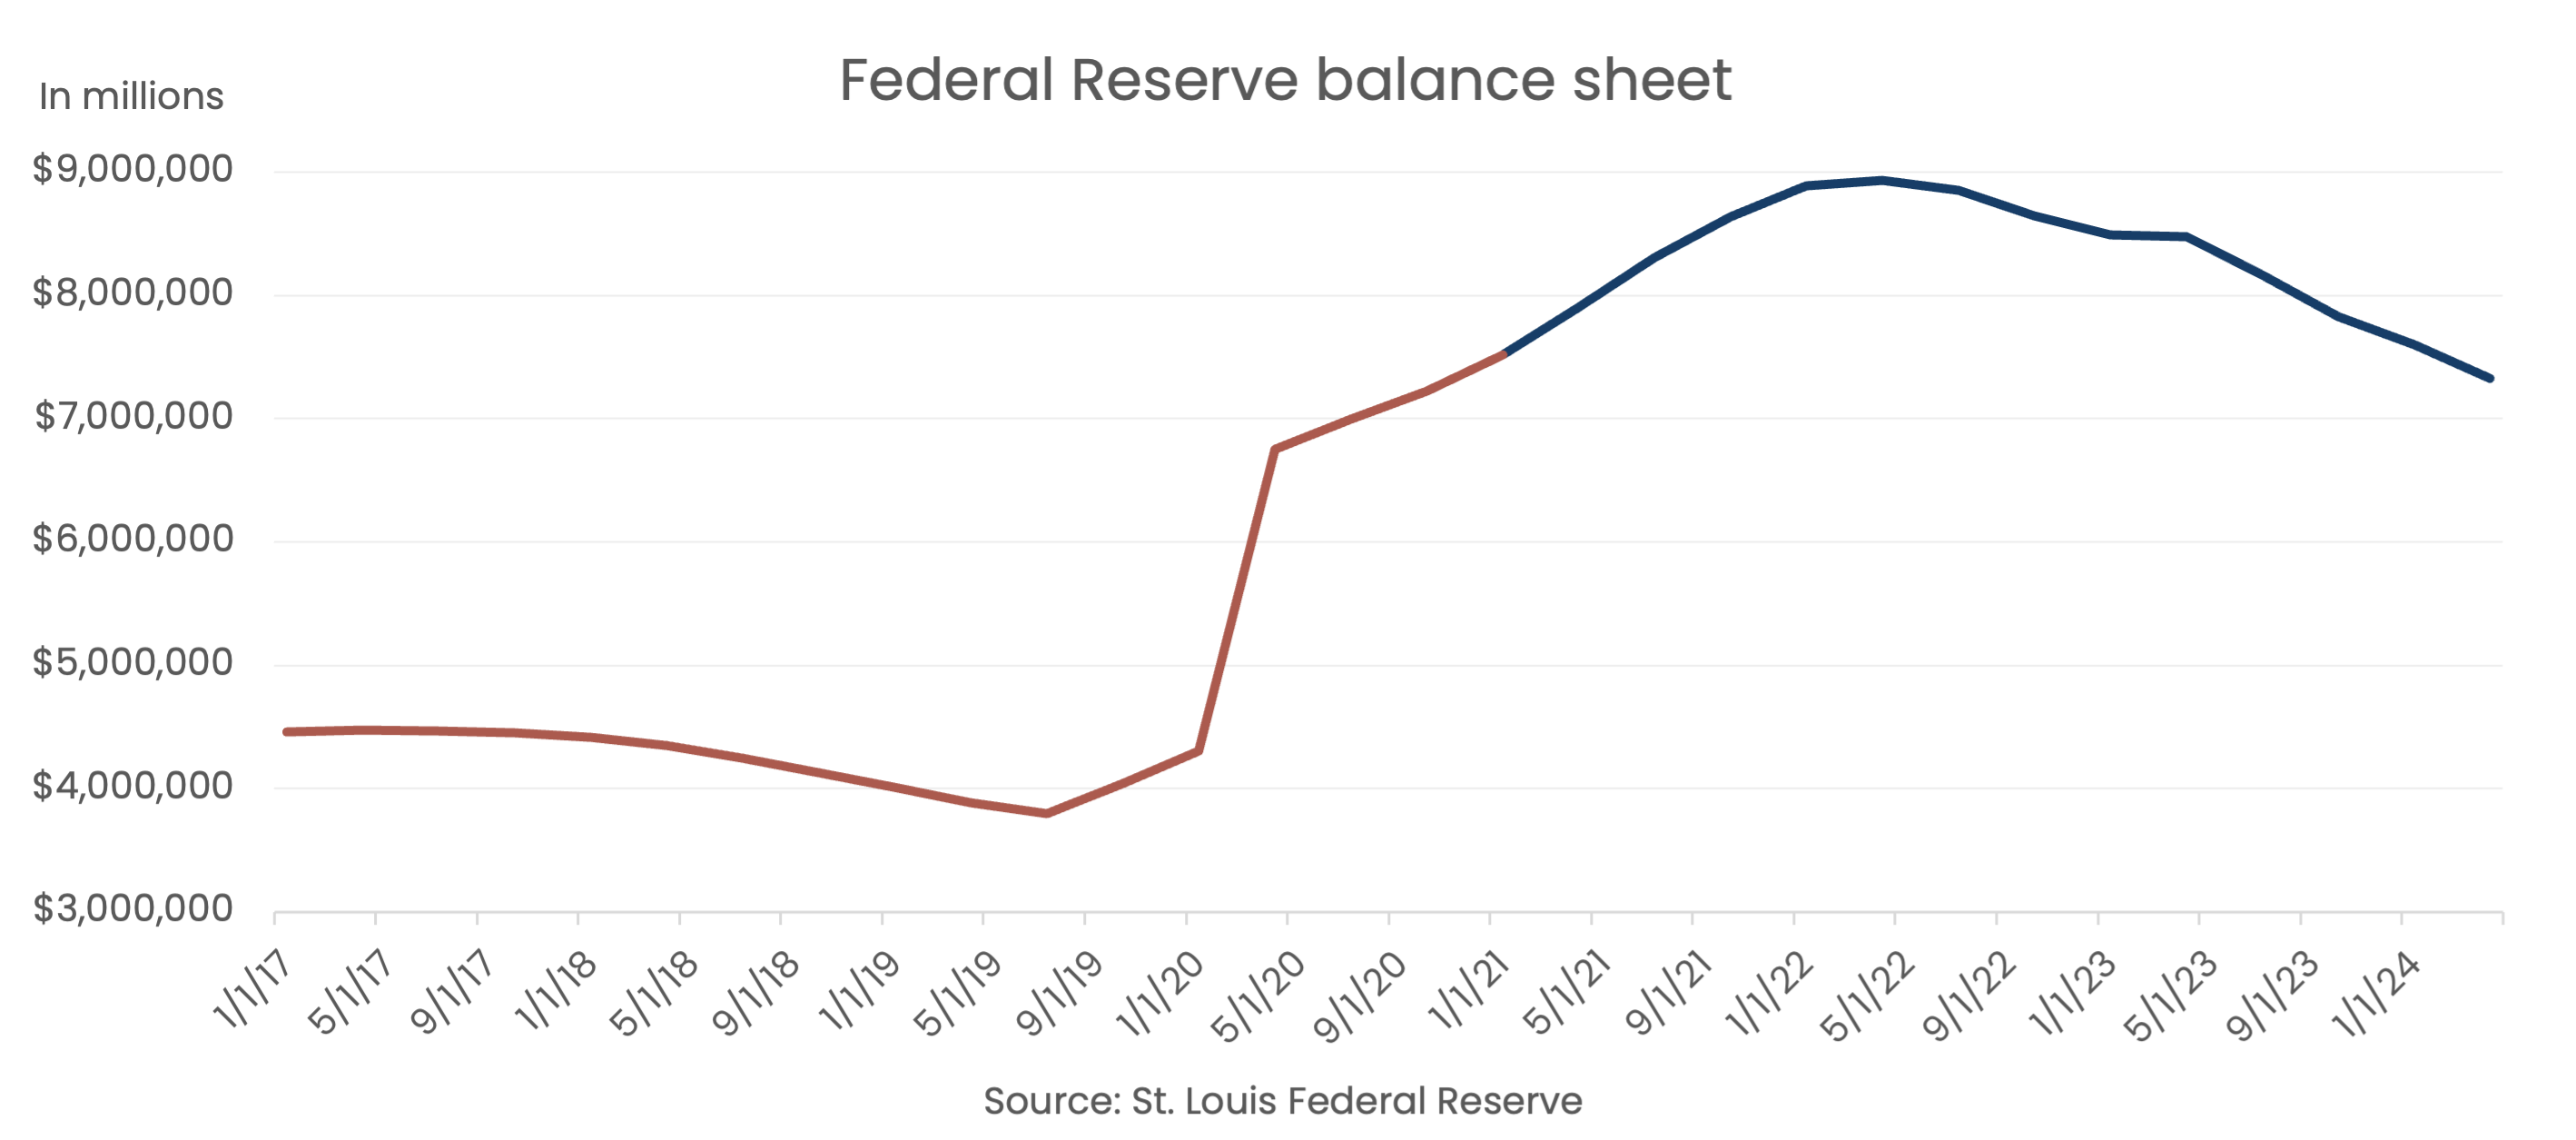
As you might imagine, this can lead to inflation. However, the Fed expanded its balance sheet significantly in the wake of the financial crisis without a jump in inflation, so it’s not necessarily a given. Remember: A certain amount of inflation (2-3%) is healthy in a growing economy.
What do these stats mean?
As politicians ramp up their discussion of the economy, including various data points and policy suggestions, it can be hard to determine what’s really going on. We hope this article helps illuminate that the U.S. economy is far more complex than a soundbite.
What’s more, our economy has historically skewed towards growth, thanks in large part to American innovation. Taking a long-term view of the economy can help you weather campaign season and stay focused on your financial plan.
If you have questions about how specific policy proposals might affect your financial plan, feel free to reach out.
